Images as high dimensional data#
Mahmood Amintoosi, Fall 2024
Computer Science Dept, Ferdowsi University of Mashhad
# Importing Necessary Libraries
import numpy as np
import matplotlib.pyplot as plt
img = np.random.randint(10, size=(5,6))
img
array([[3, 0, 5, 6, 3, 3],
       [4, 8, 6, 5, 4, 7],
       [6, 6, 1, 7, 8, 1],
       [9, 1, 0, 6, 7, 8],
       [4, 5, 1, 4, 0, 5]])
plt.figure(figsize=(3,4))
plt.imshow(img, cmap=plt.cm.gray)
<matplotlib.image.AxesImage at 0x1fac7673220>
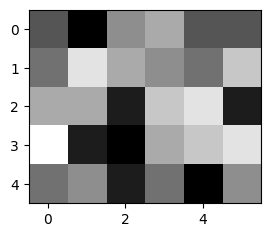
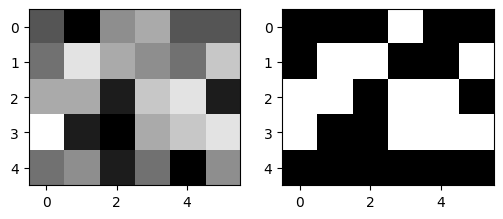
Image segmentation by thresholding#
seg_img = img > 5
type(seg_img), seg_img
(numpy.ndarray,
 array([[False, False, False,  True, False, False],
        [False,  True,  True, False, False,  True],
        [ True,  True, False,  True,  True, False],
        [ True, False, False,  True,  True,  True],
        [False, False, False, False, False, False]]))
# plot each image ...
# ... side by side
fig=plt.figure(figsize=(6, 4))
fig.add_subplot(1, 2, 1)   # subplot one
plt.imshow(img, cmap=plt.cm.gray)

fig.add_subplot(1, 2, 2)   # subplot two
# my data is OK to use gray colormap (0:black, 1:white)
plt.imshow(seg_img, cmap=plt.cm.gray)  # use appropriate colormap here
<matplotlib.image.AxesImage at 0x1fac7582cd0>
https://www.geeksforgeeks.org/image-segmentation-using-pythons-scikit-image-module/
# !pip install scikit-image
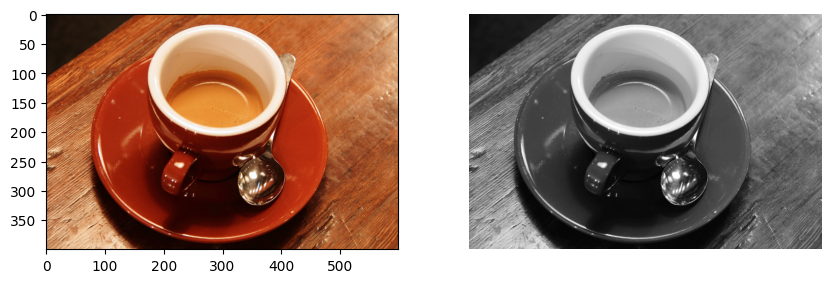
RGB2Gray#
# Importing Necessary Libraries
from skimage import data
from skimage.color import rgb2gray
import matplotlib.pyplot as plt

# Sample Image of scikit-image package
coffee = data.coffee()
coffee.shape,  type(coffee[0,0,0])
((400, 600, 3), numpy.uint8)
# Setting the plot size to 15,15
plt.figure(figsize=(10, 5))
plt.subplot(1, 2, 1)

# Displaying the sample image
plt.imshow(coffee)

# Converting RGB image to Monochrome
gray_coffee = rgb2gray(coffee)
plt.subplot(1, 2, 2)

# Displaying the sample image - Monochrome
# Format
plt.axis('off')
plt.imshow(gray_coffee, cmap="gray")
<matplotlib.image.AxesImage at 0x1fac76e1970>
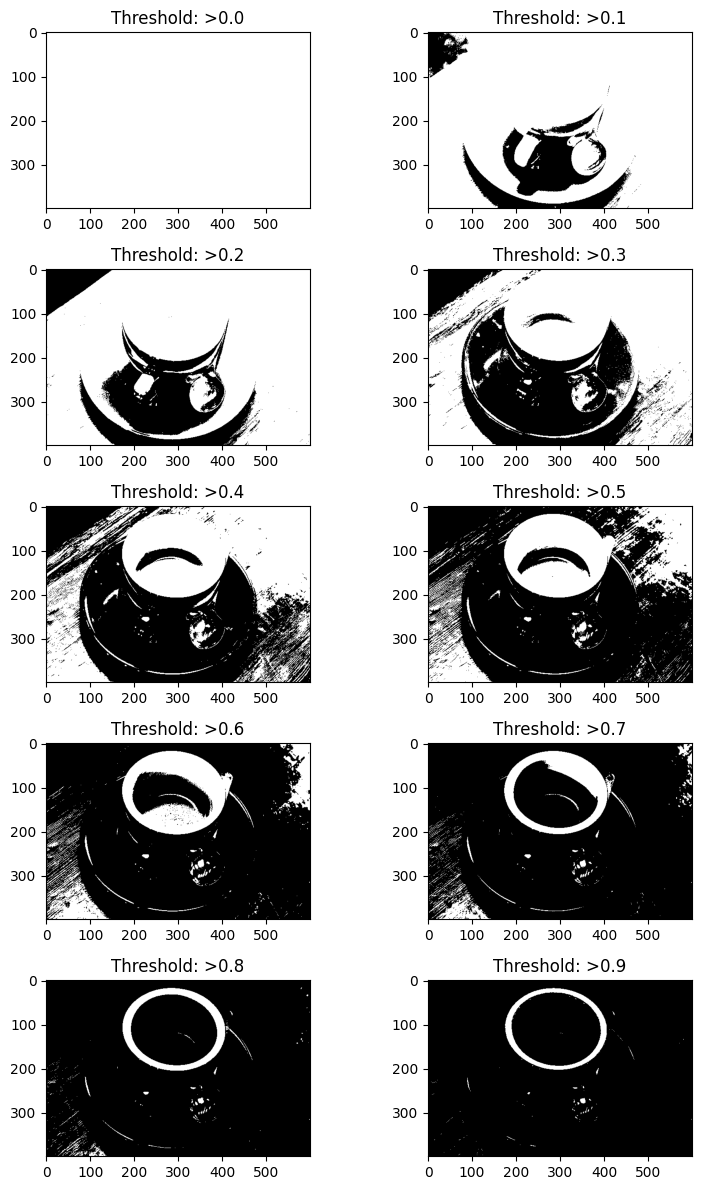
plt.figure(figsize=(8, 12))

for i in range(10):

    # Iterating different thresholds
    binarized_gray = gray_coffee > i*0.1
    plt.subplot(5,2,i+1)

    # Rounding of the threshold
    # value to 1 decimal point
    plt.title("Threshold: >"+str(round(i*0.1,1)))

    # Displaying the binarized image
    # of various thresholds
    plt.imshow(binarized_gray, cmap = 'gray', vmin=0, vmax=1)

plt.tight_layout()