k-means in high dimensional spaces#
Mahmood Amintoosi, Fall 2024
Computer Science Dept, Ferdowsi University of Mashhad
Show code cell source
import numpy as np
import matplotlib.pyplot as plt
from sklearn.datasets import make_classification
from sklearn.cluster import KMeans
from sklearn.metrics import adjusted_rand_score
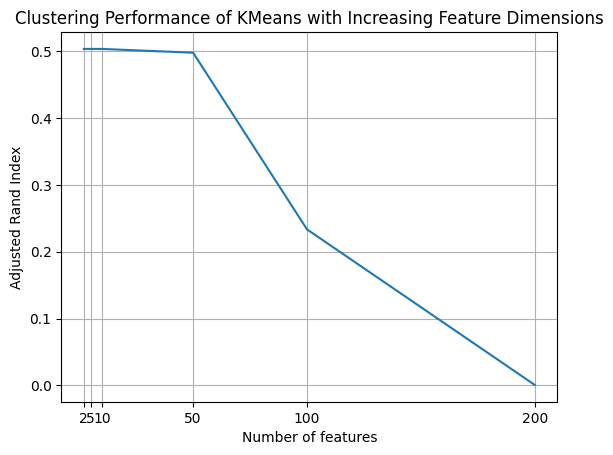
n_samples = 1000
n_classes = 2
# Define an empty list to store the scores
scores = []
n_dimensions = [2, 5, 10, 50, 100, 200] # List of dimensions to evaluate
for d in n_dimensions:
# Generate synthetic Gaussian data
X, y = make_classification(
n_samples=n_samples,
n_features=d,
n_classes=n_classes,
n_redundant=0,
n_informative=2,
random_state=1,
n_clusters_per_class=1,
)
# Fit KMeans
kmeans = KMeans(n_clusters=n_classes, random_state=42)
kmeans.fit(X)
# Predict the cluster labels
y_pred = kmeans.labels_
# Compute the clustering score using Adjusted Rand Index
score = adjusted_rand_score(y, y_pred)
scores.append(score)
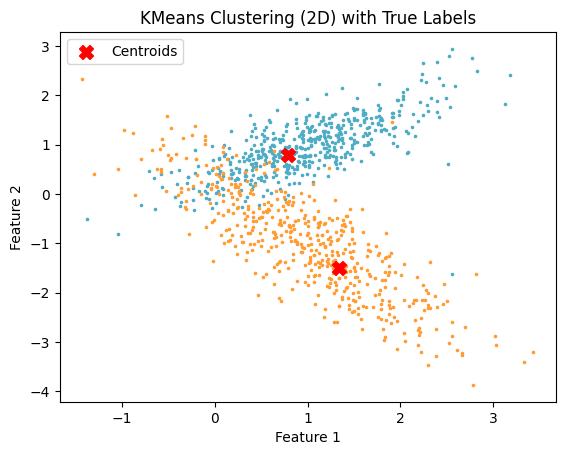
if d == 2:
# Plot initial seeds alongside sample data for the 2D case
plt.figure(1)
colors = ["#4EACC5", "#FF9C34"]
for k in range(n_classes):
cluster_data = y == k
plt.scatter(X[cluster_data, 0], X[cluster_data, 1], c=colors[k], marker=".", s=10)
# Plot cluster centroids
centroids = kmeans.cluster_centers_
plt.scatter(centroids[:, 0], centroids[:, 1], c='red', marker='X', s=100, label='Centroids')
plt.legend()
plt.title("KMeans Clustering (2D) with True Labels")
plt.xlabel("Feature 1")
plt.ylabel("Feature 2")
plt.show()
# Plot the clustering scores versus the number of features
plt.plot(n_dimensions, scores)
plt.xlabel("Number of features")
plt.ylabel("Adjusted Rand Index")
plt.title("Clustering Performance of KMeans with Increasing Feature Dimensions")
plt.xticks(n_dimensions)
plt.grid()
plt.show()