
High Dimensional Data & the curse of dimensionality#
Mahmood Amintoosi, Fall 2024
Computer Science Dept, Ferdowsi University of Mashhad
در فضاهای با ابعاد بالا:
مفهوم محلی بودن کمرنگ میشود، ESL
حجم ابرکره تقریبا صفر است، کتاب زکی
حجم اصلی فضا در گوشهها هست
اکثر چگالی کره در پوستهی آن جمع است، کتاب زکی
با بردارهای با مؤلفههای گوسی، بیشتر چگالی نقاط در فاصله خاصی تا مرکز است
همه بردارهای قطری، عمود بر محورها هستند، کتاب زکی
بردارهای با مؤلفههای گوسی عمود بر هم هستند؟
برای آزمون برخی از اینها باید نقاطی با توزیع یکنواخت در داخل ابرکره تولید کنیم
import numpy as np
import matplotlib.pyplot as plt
import seaborn as sns
from scipy.stats import norm
x = np.random.randn(10000)
sns.displot(x, kde=True)
C:\Users\m.amintoosi\AppData\Roaming\Python\Python310\site-packages\seaborn\_oldcore.py:1119: FutureWarning: use_inf_as_na option is deprecated and will be removed in a future version. Convert inf values to NaN before operating instead.
  with pd.option_context('mode.use_inf_as_na', True):
C:\Users\m.amintoosi\AppData\Roaming\Python\Python310\site-packages\seaborn\axisgrid.py:118: UserWarning: The figure layout has changed to tight
  self._figure.tight_layout(*args, **kwargs)
<seaborn.axisgrid.FacetGrid at 0x1e251916ce0>
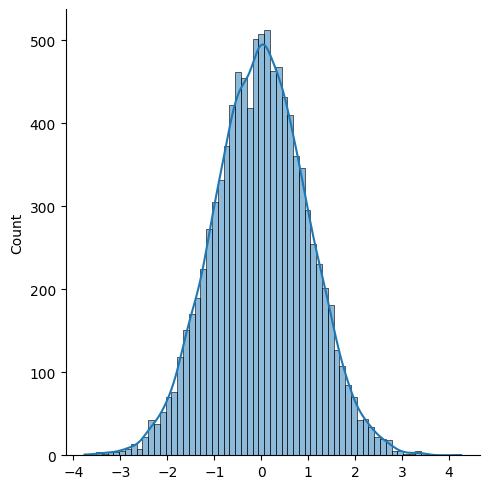
میانگین ایکس صفر هست اما میانگین قدرمطلق ایکسها که اندازه فاصله آنها تا مبدا هست، صفر نیست.
abs_x = np.abs(x)
print(abs_x.mean(), np.sqrt(np.var(x)))
# sns.displot(abs_x, kde=False)
0.7963389532877564 0.999001957122858
According to Wiki: most of the volume of the d-cube concentrates near the boundary of a sphere of radius \(\sigma \sqrt{d}\)
Also according to section Distance of Points from the Mean of Chap 6 of Zaki: whereas the density of the standard multivariate normal is maximized at the center 0, most of the probability mass (the points) is concentrated in a small band around the mean distance of \(\sqrt{d}\) from the center.
x = np.random.randn(100, 2)
norm_x = np.linalg.norm(x, axis=1)
print(norm_x.mean(), np.sqrt(2))
# sns.displot(norm_x, kde=False)
1.3573055706605999 1.4142135623730951
x = np.random.randn(10000, 200)
norm_x = np.linalg.norm(x, axis=1)
print(norm_x.mean(), np.sqrt(200))
14.13576670923273 14.142135623730951
برمیگردیم به تولید نقاط تصادفی در گوی واحد.
ابتدا تولید نقاط تصادفی با توزیع یکنواخت بر روی دایره.
روش مختصات قطبی قابل تعمیم به فضاهای بالاتر نیست.
نشان می دهیم که اگر داده ها با توزیع نرمال در فضا تولید شده و سپس بر روی کره واحد نگاشت شوند توزیع آنها بر روی سطح کره یکنواخت هست
اگر هر داده را بر نرمش تقسیم کنیم، اندازهی همه دادهها یک خواهد شد و روی کرهی واحد قرار خواهند گرفت
مطابق روابط ۱.۱۹ و ۱.۲۰ از کتاب زکی تابع چگالی ایکس به صورت زیر است:
Joint probability function of \(x\) is given as:
دوباره تکه برنامه قبلی رو مینویسیم
x = np.random.randn(100, 2)
norm_x = np.linalg.norm(x, axis=1)
print(norm_x.mean(), np.sqrt(2))
# sns.displot(norm_x, kde=False)
x.shape, norm_x[:,np.newaxis].shape
1.333765378402273 1.4142135623730951
((100, 2), (100, 1))
y = x/norm_x[:,np.newaxis]
plt.scatter(x[:,0],x[:,1], 2)
plt.scatter(y[:,0],y[:,1], 5)
ax = plt.gca()
ax.set_aspect('equal', adjustable='box')
plt.draw()
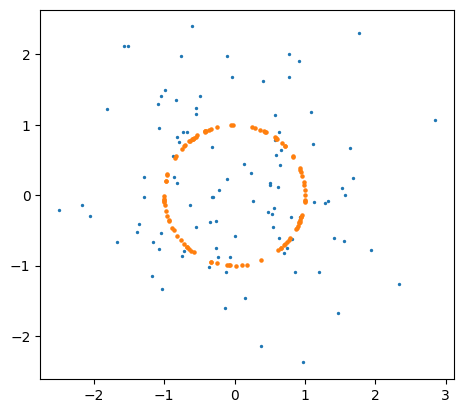
با داشتن اعداد تصادفی با توزیع یکنواخت میتوان اعداد تصادفی با هر توزیعی تولید کرد
Cumulative Distribution Function#
For random variable \(X\), its cumulative distribution function (CDF) \(F:\mathbb{R} \to [0,1]\), gives the probability of observing a value at most some given value \(x\): (eq. 1.17 of Zaki)
If \(a\sim \mathcal{U}(0,1) \Rightarrow P(a\leq a_0) = a_0\)
If we get \(X=F^{-1}(a)\), then \(X\) has probabilty distribution \(F\).
Due to the monotonicity of \(F^{-1}\), the inequality \(F^{-1}(a) \leq x\) holds if and only if \(a \leq F(x)\):
حالا موارد بالا را امتحان میکنیم. ابتدا برای تولید اعداد تصادفی نرمال با استفاده از توزیع یکنواخت و بعد برای مورد تولید نقاط تصادفی در داخل گوی واحد بدون استفاده از روشی که قبلا بکار برده بودیم یعنی
Rejection Sampling.
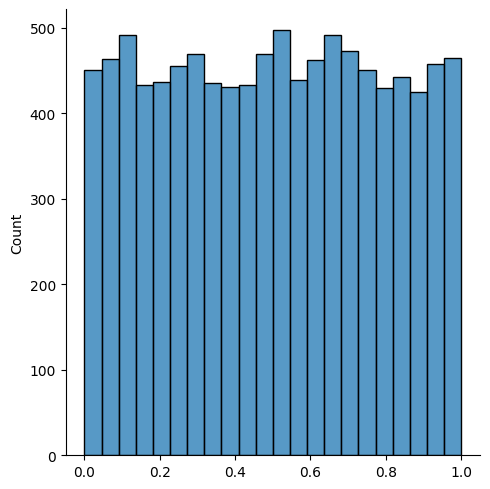
یک تعداد عدد تصادفی از توزیع یکنواخت تولید کرده و سپس با وارون تابع تجمعی توزیع نرمال به توزیع نرمال میرسیم
from statistics import NormalDist # Needs Python >= 3.8
x = np.random.rand(10000)
sns.displot(x)
C:\Users\m.amintoosi\AppData\Roaming\Python\Python310\site-packages\seaborn\_oldcore.py:1119: FutureWarning: use_inf_as_na option is deprecated and will be removed in a future version. Convert inf values to NaN before operating instead.
  with pd.option_context('mode.use_inf_as_na', True):
C:\Users\m.amintoosi\AppData\Roaming\Python\Python310\site-packages\seaborn\axisgrid.py:118: UserWarning: The figure layout has changed to tight
  self._figure.tight_layout(*args, **kwargs)
<seaborn.axisgrid.FacetGrid at 0x1e2519153c0>
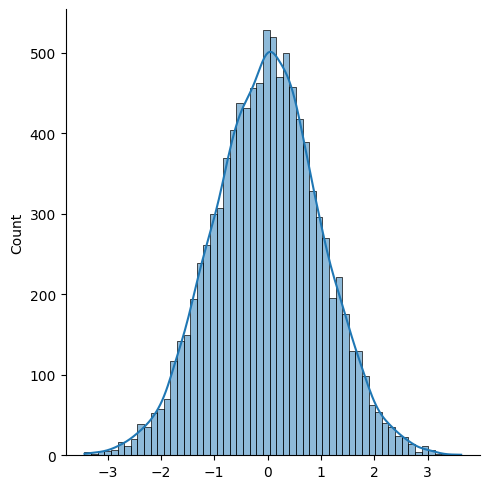
y = [NormalDist().inv_cdf(a) for a in x]
y = np.array(y)
print(y.mean(), y.var())
-0.0013618378781789012 0.9982451176139835
sns.displot(y, kde=True)
C:\Users\m.amintoosi\AppData\Roaming\Python\Python310\site-packages\seaborn\_oldcore.py:1119: FutureWarning: use_inf_as_na option is deprecated and will be removed in a future version. Convert inf values to NaN before operating instead.
  with pd.option_context('mode.use_inf_as_na', True):
C:\Users\m.amintoosi\AppData\Roaming\Python\Python310\site-packages\seaborn\axisgrid.py:118: UserWarning: The figure layout has changed to tight
  self._figure.tight_layout(*args, **kwargs)
<seaborn.axisgrid.FacetGrid at 0x1e251b7f940>
تولید نقاط تصادفی با توزیع یکنواخت در داخل گوی واحد#
یک سری نقاط تصادفی که هر مؤلفهی هر نقطه از توزیع گوسی آمده است تولید میکنیم، سپس مشابه برنامه بالا هر نقطه را بر اندازهاش تقسیم میکنیم.
x = np.random.randn(400, 2)
norm_x = np.linalg.norm(x, axis=1)
y = x/norm_x[:,np.newaxis]
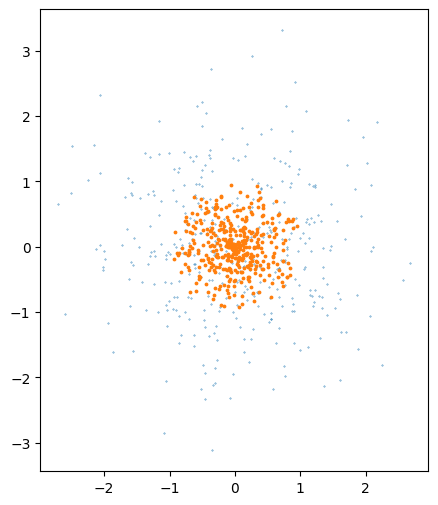
اما چگالی نقاط تولید شده در داخل دایره یکنواخت نیست.
rho = np.random.rand(len(x))
y = rho[:,np.newaxis] * x/norm_x[:,np.newaxis]
plt.figure(figsize=(6, 6))
plt.scatter(x[:,0],x[:,1],.1)
plt.scatter(y[:,0],y[:,1],3)
ax = plt.gca()
ax.set_aspect('equal', adjustable='box')
plt.draw()
قبل از ادامه، یادآوری چند تعریف از کتاب زکی:
ابتدا ابرگوی و ابرکره، رابطه ۶.۱ کتاب زکی
The data hyperspace can be represented as a \(d\)-dimensional hyperball centered at \(0\) with radius \(r\), defined as
The surface of the hyperball is called a hypersphere, and it consists of all the points exactly at distance \(r\) from the center of the hyperball
البته حجم هر دو یکسان هست، رابطه ۶.۱۰ کتاب زکی:
اگر قرار باشد چگالی نقاط در همه جا یکسان باشد، رو باید از توزیع دیگری باشد به نحوی که تابع توزیع تجمعی آن متناسب با نسبت حجم گوی به شعاع r به حجم گوی واحد باشد:
میدانیم که حجم گوی d بعدی به شعاع r، r به توان d برابر حجم گوی واحد هست یعنی:
\(a\sim \mathcal{U}(0,1)\)
a = np.random.rand(len(x))
d = 2
rho = a**(1/d)
y = rho[:,np.newaxis] * x/norm_x[:,np.newaxis]
plt.figure(figsize=(6, 6))
plt.scatter(x[:,0],x[:,1],.1)
plt.scatter(y[:,0],y[:,1],3)
ax = plt.gca()
ax.set_aspect('equal', adjustable='box')
plt.draw()
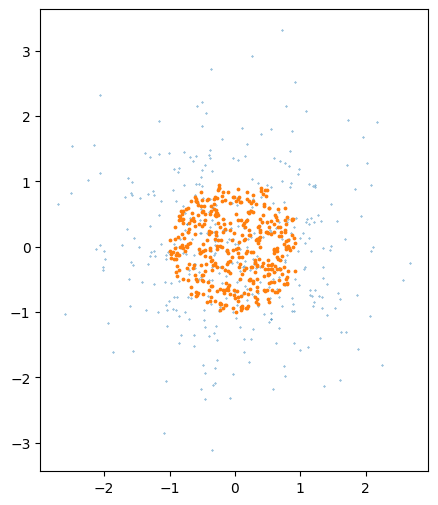
We did it :)
بررسی تقریبا متعامد بودن بردارهای با مؤلفههای گوسی در فضاهای با ابعاد بالا
x = np.random.randn(4, 200)
norm_x = np.linalg.norm(x, axis=1)
y = x/norm_x[:,np.newaxis]

# rho = np.random.rand(len(x))
# y = rho[:,np.newaxis] * y

# a = np.random.rand(len(x))
# d = 2
# rho = a**(1/d)
# y = rho[:,np.newaxis] * y

for i in range(len(y)):
    for j in range(i+1,len(y)):
        print(np.dot(y[i],y[j]))
-0.03266827994478738
-0.06715105526363858
-0.01307570018736591
0.09975298665446185
-0.023308848425242605
0.04607856574295245
تمرینها:
مقایسه تولید نقاط در گوی واحد در ابعاد بالا با روش نمونهبرداری بازپسزننده روش ذکر شده در بالا از منظر زمان اجرا
تخمین حجم ابرکره با روش مونت کارلو
تخمین نسبت حجم ابرکره به ابرمکعب محیط بر آن
تخمین نسبت حجم پوستهی به ضخامت اپسیلون به کل ابرکره