kNN in high dimensional spaces#
The curse of dimensionality#
Mahmood Amintoosi, Fall 2024
Computer Science Dept, Ferdowsi University of Mashhad
import numpy as np
from sklearn.model_selection import train_test_split
from sklearn.neighbors import KNeighborsClassifier
from sklearn.metrics import accuracy_score
from sklearn.datasets import make_classification
import matplotlib.pyplot as plt
import seaborn as sns
from scipy.stats import norm
n_samples = 1000
n_classes = 2
# Define an empty list to store the accuracy scores
scores = []
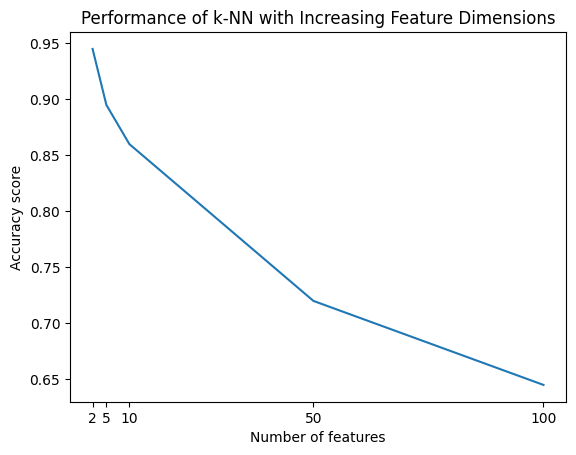
n_dimensions = [2, 5, 10, 50, 100]# , 200]#, 1000]
for d in n_dimensions:
X, y = make_classification(
n_samples=n_samples,
n_features=d,
n_classes = n_classes,
n_redundant=0,
n_informative=2,
random_state=1,
n_clusters_per_class=1,
)
# Split the data into train and test sets
X_train, X_test, y_train, y_test = train_test_split(
X, y, test_size=0.2, random_state=42
)
# Train a k-nearest neighbor classifier with k=5
clf = KNeighborsClassifier(n_neighbors=5)
clf.fit(X_train, y_train)
# Predict the test labels
y_pred = clf.predict(X_test)
# Compute the accuracy score
score = accuracy_score(y_test, y_pred)
scores.append(score)
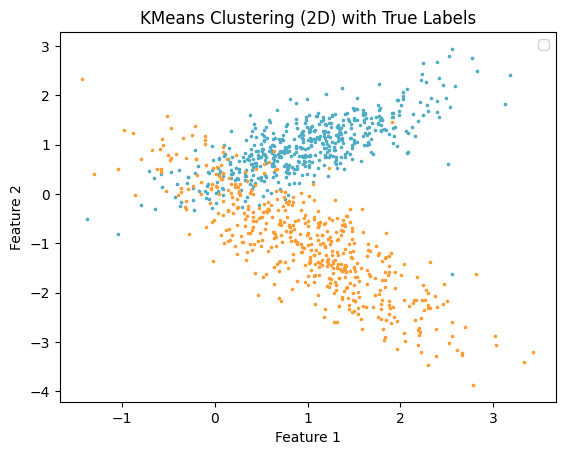
if d == 2:
# Plot init seeds along side sample data
plt.figure(1)
colors = ["#4EACC5", "#FF9C34", "#4E9A06", "m"]
for k in range(n_classes):
cluster_data = y == k
plt.scatter(X[cluster_data, 0], X[cluster_data, 1], c=colors[k], marker=".", s=10)
plt.legend()
plt.title("KMeans Clustering (2D) with True Labels")
plt.xlabel("Feature 1")
plt.ylabel("Feature 2")
plt.show()
# Plot the accuracy scores versus the number of features
plt.plot(n_dimensions, scores)
plt.xlabel("Number of features")
plt.ylabel("Accuracy score")
plt.title("Performance of k-NN with Increasing Feature Dimensions")
plt.xticks(n_dimensions)
# plt.xscale("log")
plt.show()
No artists with labels found to put in legend. Note that artists whose label start with an underscore are ignored when legend() is called with no argument.