Linear Regression, the Perceptron, and Online Learning

Linear Regression, the Perceptron, and Online Learning
Computer Science Dept, Ferdowsi University of Mashhad
Just as naive Bayes (a topic of another course) is a good starting point for classification tasks, linear regression models are a good starting point for regression tasks. Such models are popular because they can be fit quickly and are straightforward to interpret. You are already familiar with the simplest form of linear regression model (i.e., fitting a straight line to two-dimensional data), but such models can be extended to model more complicated data behavior.
Notebook Cell
# Auto-setup when running on Google Colab
import os
if 'google.colab' in str(get_ipython()) and not os.path.exists('/content/data-mining'):
    !git clone -q https://github.com/fum-cs/data-mining.git /content/data-mining
    # !pip --quiet install -r /content/data-mining/requirements_colab.txt
    %cd data-mining/notebooks
Notebook Cell
import warnings

warnings.filterwarnings("ignore")
import numpy as np
from sklearn.model_selection import train_test_split

# This is needed to render the plots
from utils.utils import *
Linear Model
Suppose that the true model is denoted by and the estimated model denoted by (Eq. 23.2 of Zaki book Zaki & Meira (2020)):
If we have:
then can be considered as dot product of two vectors:
If instance is shown by
then:
Sum of Squared Error (SSE):
where:
Data Generation
Synthetic Data Generation
true_w0 = 1  # b in mx+b
true_w1 = 2  # m in mx+b
N = 100

# Data Generation
np.random.seed(42)
x = np.random.rand(N, 1)

epsilon = 0.1 * np.random.randn(N, 1)
y = true_w0 + true_w1 * x + epsilon

# Add a column of 1s to x

# ones = np.ones((N, 1))
# X = np.concatenate([ones, x],axis=1)
X = np.insert(x, 0, 1, axis=1)
print(x.shape, X.shape)
print(x[:3])
print(y[:3])
(100, 1) (100, 2)
[[0.37454012]
[0.95071431]
[0.73199394]]
[[1.75778494]
[2.87152788]
[2.47316396]]
figure0(x, y)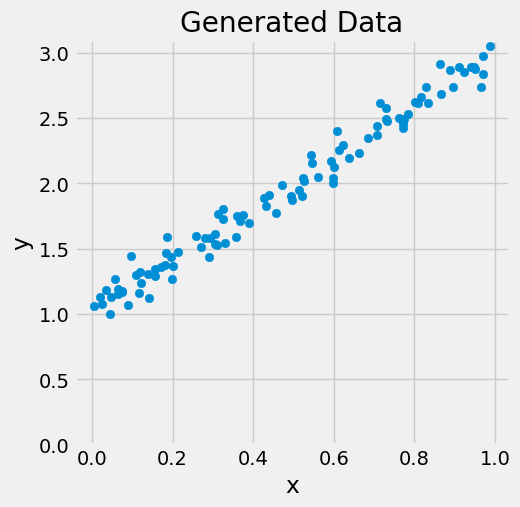
Normal Equations
The Normal Equations provide a closed-form solution for finding the optimal parameters (coefficients) that minimize the cost function (usually the mean squared error) in linear regression.
The Normal Equations are derived by setting the partial derivatives of the cost function with respect to each coefficient to zero.
The Closed Form Solution refers to finding the optimal parameters directly using a mathematical formula, rather than an iterative optimization process.
We have to minimize: wrt , which is equal to the famous form . Temporary we use , instead of and ignore the bold faces of letters; hence we have to minimize
We Know that (See Matrix Calculus in Wikipedia):
and if be a symmetric matrix:
Hence:
Set the derivative equal to zero:
and with our previous notation:
w = np.linalg.inv(X.T @ X) @ X.T @ y
w
array([[1.02150962],
[1.95402268]])Using Scikit-learn
from sklearn.linear_model import LinearRegression

linreg = LinearRegression()
linreg.fit(x, y)
print(linreg.intercept_, linreg.coef_)
[1.02150962] [[1.95402268]]
If we have augmented data matrix , we have to set fit_intercept=False. In eq. (23.20) of Zaki this is denoted by .
linreg = LinearRegression(fit_intercept=False)
linreg.fit(X, y)
print(linreg.coef_)
[[1.02150962 1.95402268]]
Bivariate Regression
In bivariate regression, we have two variables: one is the predictor variable (also known as the feature), and the other is the response variable (also known as the target).
Predictor Variable (Feature):
The predictor variable (often denoted as x) is the input variable that we use to predict or explain the variation in the response variable.
In machine learning, this is equivalent to a feature. Features represent the characteristics or attributes of the data points.
For example, in a housing price prediction model, features could include square footage, number of bedrooms, location, etc.
Response Variable (Target):
The response variable (often denoted as y) is the output variable that we are trying to predict or understand based on the predictor variable.
In machine learning, this is equivalent to the target. The target represents the value we want to predict.
For the housing price prediction model, the target would be the actual sale price of a house.
So, in summary, bivariate regression involves analyzing the relationship between two variables: one (the feature) is used to predict or explain the behavior of the other (the target). These terms are commonly used in both statistics and machine learning.
For further information about Multivariate Multiple Regression, see this blog post of Faradars.
Gradient Descent
In this section we are going to introduce the basic concepts underlying gradient descent. Some materials are borrowed from D2L.
One-Dimensional Gradient Descent
Gradient descent in one dimension is an excellent example to explain why the gradient descent algorithm may reduce the value of the objective function. Consider some continuously differentiable real-valued function . Using a Taylor expansion we obtain
That is, in first-order approximation is given by the function value and the first derivative at . It is not unreasonable to assume that for small moving in the direction of the negative gradient will decrease . To keep things simple we pick a fixed step size and choose . Plugging this into the Taylor expansion above we get
If the derivative does not vanish we make progress since . Moreover, we can always choose small enough for the higher-order terms to become irrelevant. Hence we arrive at
This means that, if we use
to iterate , the value of function might decline. Therefore, in gradient descent we first choose an initial value and a constant and then use them to continuously iterate until the stop condition is reached, for example, when the magnitude of the gradient is small enough or the number of iterations has reached a certain value.
Gradient Descent on 
For simplicity we choose the objective function to illustrate how to implement gradient descent. Although we know that is the solution to minimize , we still use this simple function to observe how changes.
# Defining a simple quadratic function and its derivative
f = lambda x: x**2
f_prime = lambda x: 2 * x

# Generating values
x = np.linspace(-10, 10, 400)
y = f(x)

# Gradient descent settings
learning_rate = 0.1
x_start = 9.0  # Starting point
steps = [x_start]
n_iterations = 15

# Gradient Descent Iteration
for _ in range(n_iterations):
    print(
        "x = {:4.2f}, f'(x) = {:5.2f}, -lr*f'(x)={:5.2f}".format(
            x_start, f_prime(x_start), -learning_rate * f_prime(x_start)
        )
    )
    x_start = x_start - learning_rate * f_prime(x_start)
    steps.append(x_start)

# Plotting the function
plt.figure(figsize=(8, 5))
plt.plot(x, y, lw=2, color="blue", label="f(x) = x²")

# Plotting the steps
plt.scatter(steps, f(np.array(steps)), color="red", s=100, label="Steps")
plt.plot(steps, f(np.array(steps)), color="red", linestyle="--", lw=1.5)

# Annotations and labels
plt.title("Gradient Descent on f(x) = x²")
plt.xlabel("x")
plt.ylabel("f(x)")
plt.legend()
plt.grid(True)
plt.show()
x = 9.00, f'(x) = 18.00, -lr*f'(x)=-1.80
x = 7.20, f'(x) = 14.40, -lr*f'(x)=-1.44
x = 5.76, f'(x) = 11.52, -lr*f'(x)=-1.15
x = 4.61, f'(x) = 9.22, -lr*f'(x)=-0.92
x = 3.69, f'(x) = 7.37, -lr*f'(x)=-0.74
x = 2.95, f'(x) = 5.90, -lr*f'(x)=-0.59
x = 2.36, f'(x) = 4.72, -lr*f'(x)=-0.47
x = 1.89, f'(x) = 3.77, -lr*f'(x)=-0.38
x = 1.51, f'(x) = 3.02, -lr*f'(x)=-0.30
x = 1.21, f'(x) = 2.42, -lr*f'(x)=-0.24
x = 0.97, f'(x) = 1.93, -lr*f'(x)=-0.19
x = 0.77, f'(x) = 1.55, -lr*f'(x)=-0.15
x = 0.62, f'(x) = 1.24, -lr*f'(x)=-0.12
x = 0.49, f'(x) = 0.99, -lr*f'(x)=-0.10
x = 0.40, f'(x) = 0.79, -lr*f'(x)=-0.08
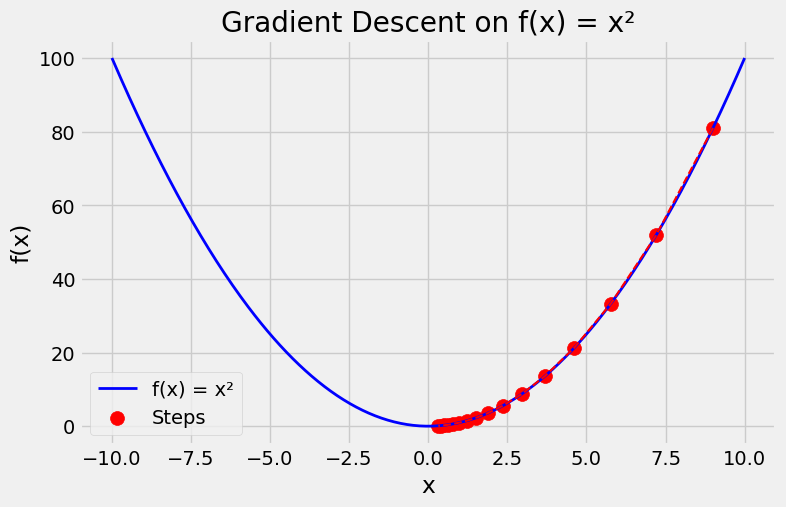
And another function see where is solved in ADS course using PSO.
# Defining a simple quadratic function and its derivative
f = lambda x: 3 * np.sin(x) + (0.1 * x - 3) ** 2
f_prime = lambda x: 3 * np.cos(x) + 0.2 * (0.1 * x - 3)

# Generating values
x = np.linspace(0, 60, 400)
y = f(x)

# Gradient descent settings
learning_rate = 0.1
x_start = 20  # Starting point
steps = [x_start]
n_iterations = 15

# Gradient Descent Iteration
for _ in range(n_iterations):
    x_start = x_start - learning_rate * f_prime(x_start)
    steps.append(x_start)

# Plotting the function
plt.figure(figsize=(8, 6))
plt.plot(x, y, lw=2, color="blue", label="f(x) = 3sin(x)+(0.1x-3)²")

# Plotting the steps
plt.scatter(steps, f(np.array(steps)), color="red", s=100, label="Steps")
plt.plot(steps, f(np.array(steps)), color="red", linestyle="--", lw=1.5)

# Annotations and labels
plt.title("Gradient Descent on f(x) = 3sin(x)+(0.1x-3)²")
plt.xlabel("x")
plt.ylabel("f(x)")
plt.legend()
plt.grid(True)
plt.show()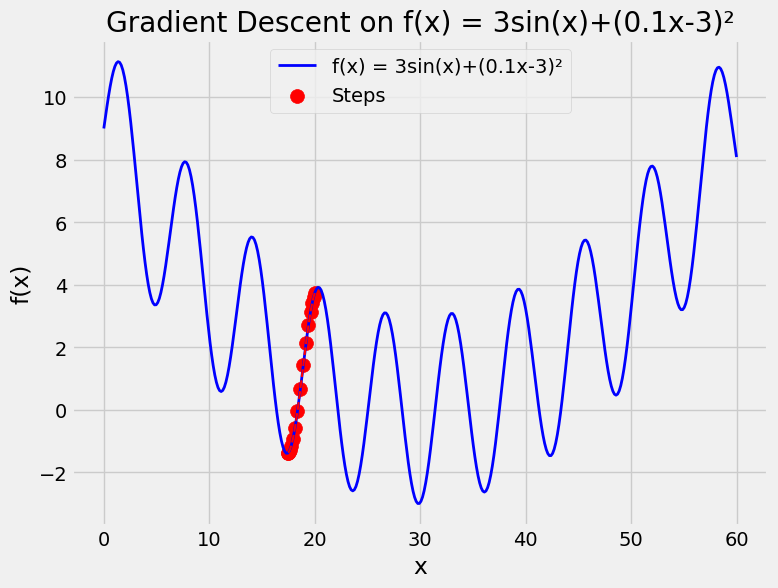
Using Gradient Descent for Regression in Machine Learning
Here we use training data for estimation of the model parameters and report the error on test data
# Reproduce our data
true_w0 = 1  # b in mx+b
true_w1 = 2  # m in mx+b
N = 100

# Data Generation
np.random.seed(42)
x = np.random.rand(N, 1)

epsilon = 0.1 * np.random.randn(N, 1)
y = true_w0 + true_w1 * x + epsilon
X = np.insert(x, 0, 1, axis=1)
Train-Test Split
x_train, x_test, y_train, y_test = train_test_split(X, y, test_size=0.2)x_train.shape, y_train.shape((80, 2), (80, 1))figure1(x_train, y_train, x_test, y_test)(<Figure size 1200x600 with 2 Axes>,
array([<Axes: title={'center': 'Generated Data - Train'}, xlabel='x', ylabel='y'>,
<Axes: title={'center': 'Generated Data - Test'}, xlabel='x', ylabel='y'>],
dtype=object))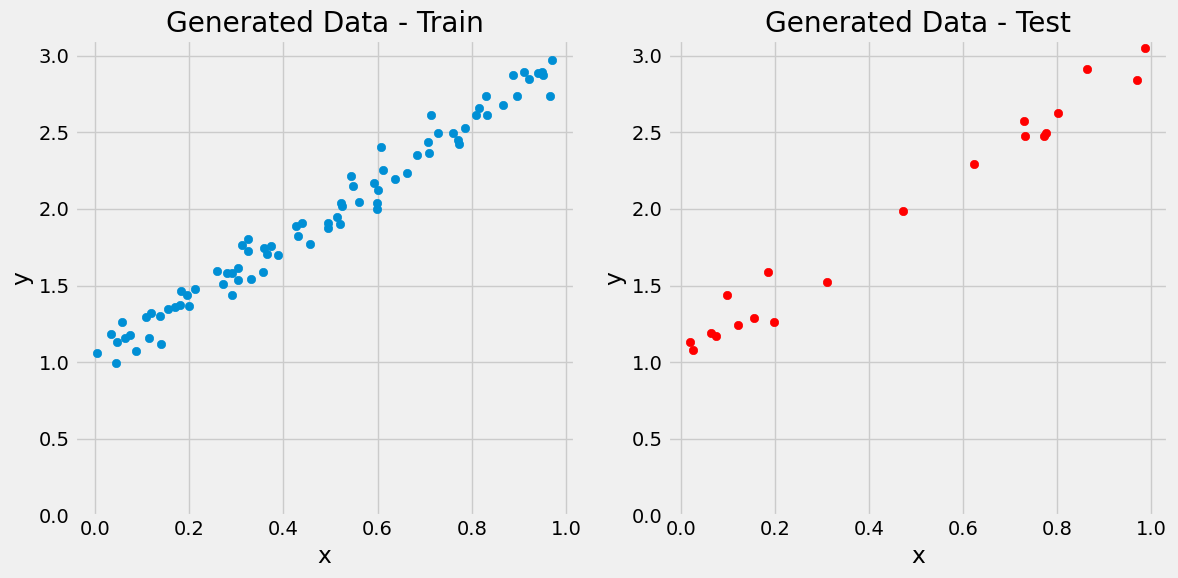
Step 0: Random Initialization
# Step 0 - Initializes parameters "b" and "w" randomly
np.random.seed(42)
w = np.random.randn(2, 1)
print(w)
[[ 0.49671415]
[-0.1382643 ]]
Step 1: Compute Model’s Predictions
# Step 1 - Computes our model's predicted output - forward pass
# y_hat = b + m * x_train
y_hat = w[0] + w[1] * x_train[:, 1]
y_hat[:3]
array([0.39881299, 0.41404593, 0.36925186])y_hat = x_train @ w
y_hat[:3]array([[0.39881299],
[0.41404593],
[0.36925186]])figure2(x_train, y_train, w[0], w[1])(<Figure size 600x600 with 1 Axes>, <Axes: xlabel='x', ylabel='y'>)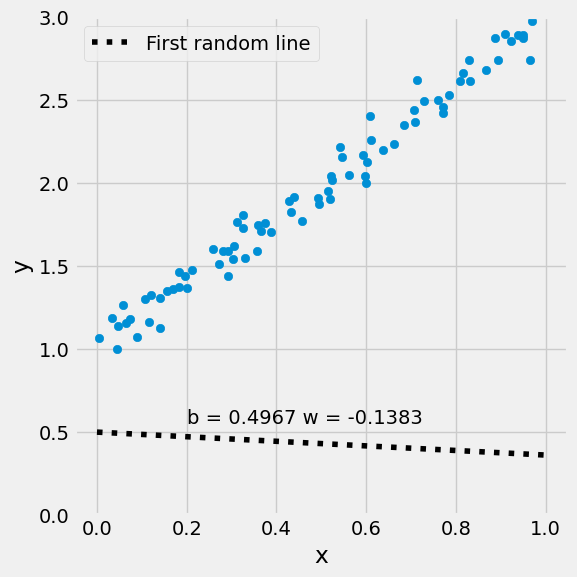
Step 2: Compute the Loss
$$
\begin{aligned} error_i &= \hat{y_i} - y_i\ where:\ y &= true_w_0 + true_w_1 x_1 + \epsilon\ &\hat{y}= w_0 x_0+ w_1 x_1 \end{aligned} $$
print(y_train[0], y_hat[0])
figure3(x_train, y_train, w[0], w[1])
[2.36596945] [0.39881299]
(<Figure size 600x600 with 1 Axes>, <Axes: xlabel='x', ylabel='y'>)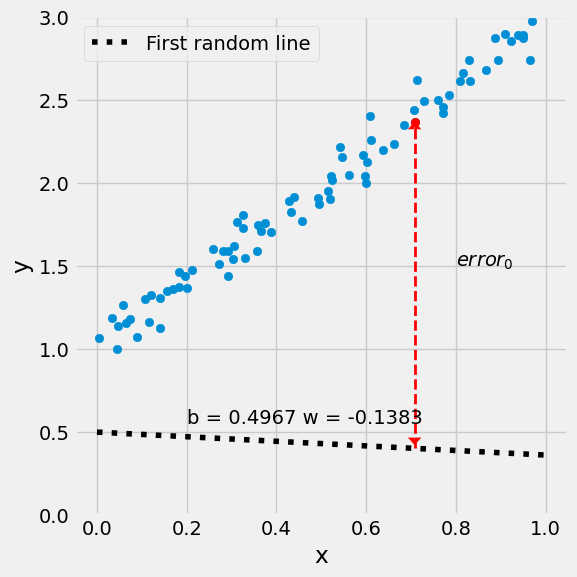
$$
\begin{aligned} MSE &= \frac{1}{n} \sum_{i=1}^n{error_i}^2 \ &= \frac{1}{n} \sum_{i=1}^n{(\hat{y_i} - y_i)}^2 \ &= \frac{1}{n} \sum_{i=1}^n{(w_0 x_{i,0} + w_1 x_{i,1} - y_i)}^2 \end{aligned} $$
# Step 2 - Computing the loss
# We are using ALL data points, so this is BATCH gradient
# descent. How wrong is our model? That's the error!
error = y_hat - y_train
print(error.shape)
# It is a regression, so it computes mean squared error (MSE)
loss = (error**2).mean()
print(loss)
(80, 1)
2.6401126993616817
Loss Surface
w0s, w1s, all_losses = mesh_losses(true_w0, true_w1, x_train, y_train)figure4(x_train, y_train, w[0], w[1], w0s, w1s, all_losses)(<Figure size 1200x600 with 2 Axes>,
(<Axes3D: title={'center': 'Loss Surface'}, xlabel='b', ylabel='w'>,
<Axes: title={'center': 'Loss Surface'}, xlabel='b', ylabel='w'>))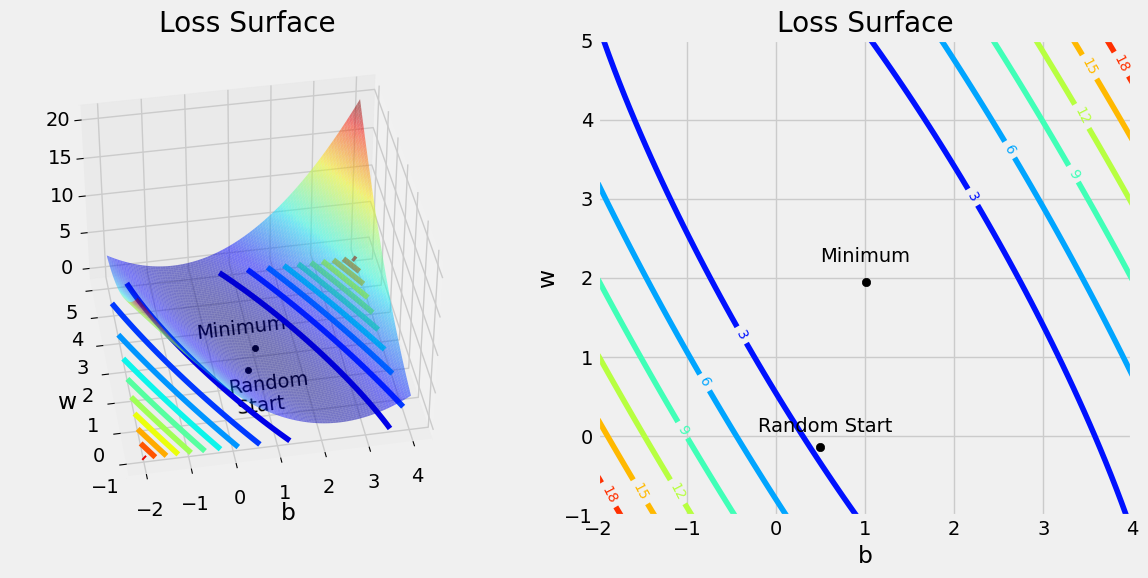
Step 3: Compute the Gradients
# Step 3 - Computes gradients for both "b" and "w" parameters
w0_grad = 2 * error.mean()
# w1_grad = 2 * (x_train[:,1] * error).mean() # Wrong!
w1_grad = 2 * (np.delete(x_train, 0, axis=1) * error).mean()
print(w0_grad, w1_grad)
-3.0224384959608583 -1.7706733515907813
(x_train * error).shape(80, 2)Vectorized form
# w_grad = 2 * (x_train * error).mean() # Wrong
w_grad = 2 * (x_train * error).mean(axis=0)
print(w_grad.shape, w_grad)
w_grad = np.reshape(w_grad, (2, 1))
print(w_grad.shape, w_grad)
(2,) [-3.0224385 -1.77067335]
(2, 1) [[-3.0224385 ]
[-1.77067335]]
Backpropagation
Step 4: Update the Parameters
$$
\begin{aligned} & b = b - \eta \frac{\partial{MSE}}{\partial{b}} \ & w = w - \eta \frac{\partial{MSE}}{\partial{w}} \end{aligned} $$
print(w.shape, w_grad.shape)(2, 1) (2, 1)
# Sets learning rate - this is "eta" ~ the "n" like Greek letter
lr = 0.1
print(w[0], w[1])

# Step 4 - Updates parameters using gradients and the
# learning rate
# w[0] = w[0] - lr * w0_grad
# w[1] = w[1] - lr * w1_grad
w = w - lr * w_grad

print(w)
print(w[0])
[0.49671415] [-0.1382643]
[[0.798958 ]
[0.03880303]]
[0.798958]
figure9(x_train, y_train, w[0], w[1])(<Figure size 600x600 with 1 Axes>, <Axes: xlabel='x', ylabel='y'>)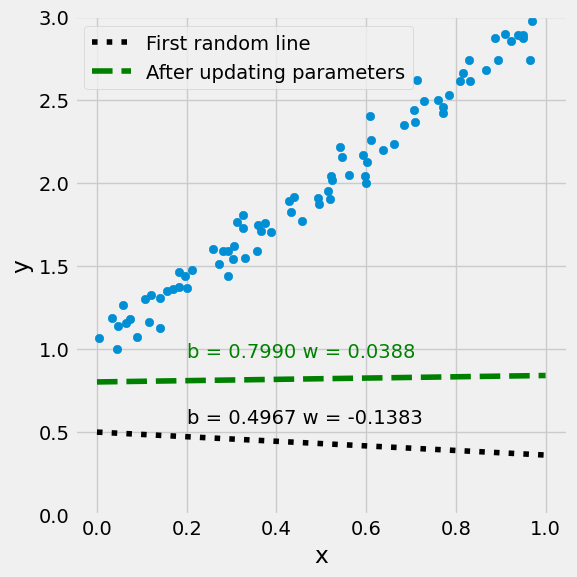
Step 5: Repeat the above updating!
# Initializes parameters "b" and "w" randomly
np.random.seed(42)
w = np.random.randn(2, 1)
lr = 0.3
num_epochs = 50
Losses = np.empty(num_epochs)
for epoch in range(num_epochs):
    y_hat = x_train @ w
    error = y_hat - y_train
    loss = (error**2).mean()
    Losses[epoch] = loss
    w_grad = 2 * (x_train * error).mean(axis=0)
    w_grad = np.reshape(w_grad, (2, 1))
    w = w - lr * w_grad

w
array([[1.11648206],
[1.75056848]])figure9(x_train, y_train, w[0], w[1])(<Figure size 600x600 with 1 Axes>, <Axes: xlabel='x', ylabel='y'>)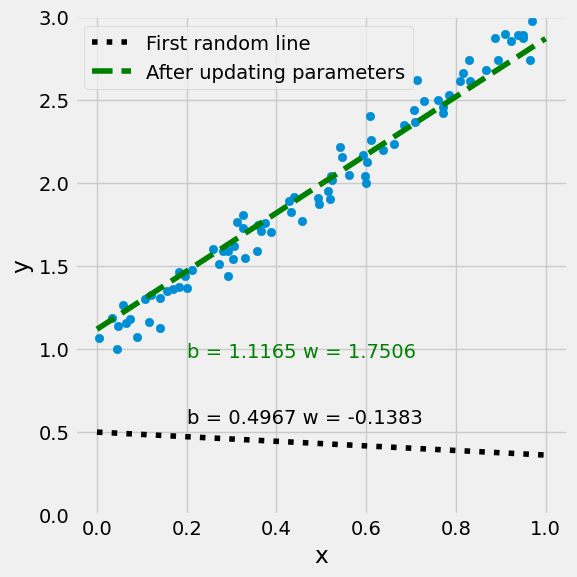
plt.plot(Losses)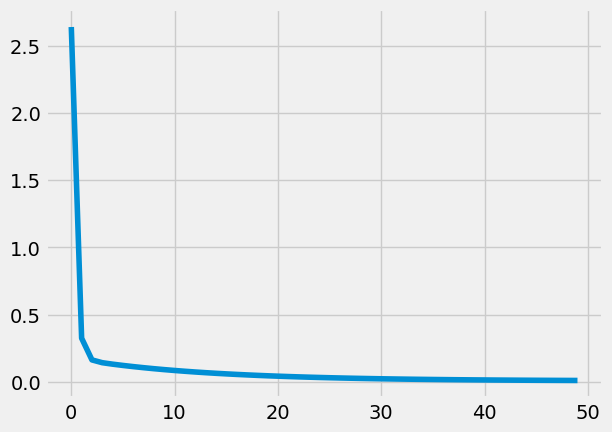
Using PyTorch auto grad
PyTorch is a Python-based tool for scientific computing that provides several main features:
torch.Tensor, an n-dimensional array similar to that ofnumpy, but which can run on GPUsComputational graphs for building neural networks
Automatic differentiation for training neural networks (more on this next lecture)
You can install PyTorch from: https://
pytorch .org/
import torch
from torch import autograd

# Initializes parameters "b" and "w" randomly
np.random.seed(42)
b = np.random.randn(1)
w = np.random.randn(1)

b = torch.tensor(b, requires_grad=True)
w = torch.tensor(w, requires_grad=True)
xTrain = torch.tensor(x_train)  # xTrain is a pyTorch Tensor
yTrain = torch.tensor(y_train) # yTrain is a pyTorch TensorBackward
Differntiationg using backward function
https://
np.random.seed(42)
w = np.random.randn(2, 1)

w = torch.tensor(w, requires_grad=True)
xTrain = torch.tensor(x_train)  # xTrain is a pyTorch Tensor
yTrain = torch.tensor(y_train)  # yTrain is a pyTorch Tensor

lr = 0.3
num_epochs = 50
for epoch in range(num_epochs):
    y_hat = xTrain @ w
    error = y_hat - yTrain
    loss = (error**2).mean(axis=0)
    # removed the manual derivative computation and use autograd instead
    loss.backward()
    with torch.no_grad():
        w -= lr * w.grad
        # Manually zero the gradients after updating weights
        w.grad = None

w
tensor([[1.1165],
[1.7506]], dtype=torch.float64, requires_grad=True)https://
PyTorch: Defining new autograd functions
PyTorch: nn module
PyTorch: optim
PyTorch: Custom nn Modules
Using PyTorch library
import torch
import torch.nn as nn

# x_train.dtype is float64, so cast both inputs to float32
xTrain = torch.tensor(x_train, dtype=torch.float32)
yTrain = torch.tensor(y_train, dtype=torch.float32)

# the same simple model as before: one input, one output, with bias
# now that the data has two columns we either use the second column only
# or define the model without a bias
model = nn.Linear(2, 1, bias=False)

learning_rate = 0.3
f = nn.MSELoss()
optimizer = torch.optim.SGD(model.parameters(), lr=learning_rate)

num_epochs = 50
for epoch in range(num_epochs):
    y_hat = model(xTrain)
    loss = f(y_hat, yTrain)
    loss.backward()  # backward propagation: calculate gradients
    optimizer.step()  # update the weights
    optimizer.zero_grad()  # clear out the gradients from the last step loss.backward()
print(model)
print(model.bias)
print(model.weight)
print(model.weight[0])
print(model.weight[0][0])
print(model.weight[0][0].item())
print(model.weight[0].detach().numpy()[0])Linear(in_features=2, out_features=1, bias=False)
None
Parameter containing:
tensor([[1.0940, 1.7949]], requires_grad=True)
tensor([1.0940, 1.7949], grad_fn=<SelectBackward0>)
tensor(1.0940, grad_fn=<SelectBackward0>)
1.093968391418457
1.0939684
w = model.weight[0].detach().numpy()
w = np.reshape(w, (2, 1))
figure9(x_train, y_train, w[0], w[1])
(<Figure size 600x600 with 1 Axes>, <Axes: xlabel='x', ylabel='y'>)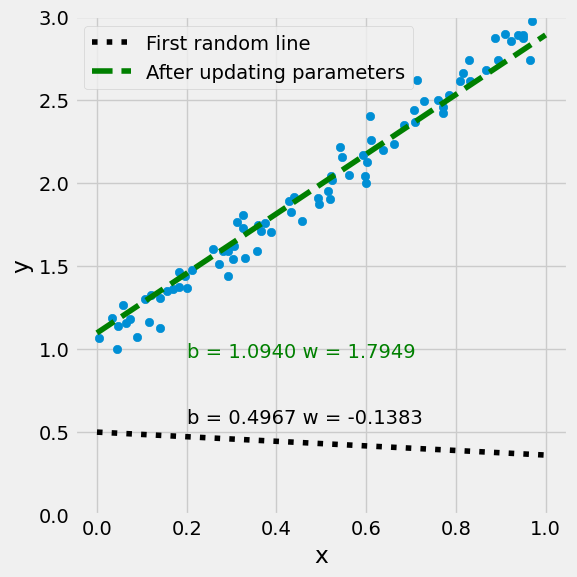
From Regression to Classification
So far the target was a number and the loss was the squared error. In classification the target is a label, and the same linear model becomes a linear score function
whose zero set is the decision boundary: a hyperplane with normal vector . Two remarks before the algorithm.
The pair is defined only up to a positive scale: and produce the same boundary. Everything below is about the direction of , not about its length.
The squared error is the wrong loss here. With labels , a confidently wrong point has a huge mean-squared loss although it is only one mistake, and a point that is correct but close to the boundary is penalised although it costs nothing. The loss that matches the decision rule is the 0-1 loss , which is flat, discontinuous and has zero gradient almost everywhere. We therefore optimise a convex surrogate and keep the 0-1 loss as the quantity we actually report.
The Perceptron
The oldest online classifier (Rosenblatt, 1958). Take labels , start from (the bias is absorbed by appending a column of ones to ) and sweep the data:
Only mistakes change the parameters, and each update moves towards the point it got wrong: after the update has increased by , so that same point is now classified correctly. Nothing is stored — no loss history, no schedule, no matrix to invert — which is why the perceptron was implementable in 1958 hardware.
Convergence (Novikoff). Assume the data are linearly separable: there is a unit vector and a number with for every , and every point satisfies . Take and start from . After mistakes two inequalities hold:
The projection grows. Each update adds , so , and by Cauchy–Schwarz .
The norm grows slowly. Because the update happens only on a mistake, , hence and therefore .
Combining the two, , that is
The bound is independent of and of — a rare luxury — but read it carefully: it counts mistakes, it is void when (non-separable data), and it says nothing about test error. A large margin is what makes the bound small, and that observation is the door to margin-based methods.
The perceptron is SGD on the hinge loss
The hinge loss of one example is
whose (sub)gradient with respect to is when and 0 otherwise. One stochastic gradient step with rate reads
Ignoring the threshold 1, this is precisely the perceptron rule. So the perceptron is not a separate species: it is the crudest member of the family used in the previous sections, with the squared loss replaced by the hinge loss and the average gradient replaced by a single-sample one.
Lab 1: the perceptron on separable data, and the bound
Two Gaussian blobs, a known separating direction, and a count of the mistakes per epoch. We also compute the two numbers of the theorem, and , and check that the total number of mistakes stays below .
rng = np.random.default_rng(6)

# Two Gaussian blobs on opposite sides of the line w_true . x = 0
w_true = np.array([1.0, -0.6])
w_true = w_true / np.linalg.norm(w_true)
centre = np.array([2.0, -1.3])
X_per = np.vstack([centre + 0.40 * rng.standard_normal((40, 2)),
                   -centre + 0.40 * rng.standard_normal((40, 2))])
y_per = np.hstack([np.ones(40), -np.ones(40)])

# Radius R and margin gamma of the theorem
R = np.linalg.norm(X_per, axis=1).max()
gamma = (y_per * (X_per @ w_true)).min()
bound = (R / gamma) ** 2


def perceptron(X, y, eta=1.0, epochs=20, seed=0):
    """Plain perceptron; returns the weight vector and the mistakes of each epoch."""
    w = np.zeros(X.shape[1])
    history = []
    local_rng = np.random.default_rng(seed)
    for _ in range(epochs):
        mistakes = 0
        for i in local_rng.permutation(len(y)):
            if y[i] * (w @ X[i]) <= 0:
                w = w + eta * y[i] * X[i]
                mistakes += 1
        history.append(mistakes)
    return w, history


w_per, mistakes_per = perceptron(X_per, y_per)
print(f"R = {R:.3f},  gamma = {gamma:.3f},  (R/gamma)^2 = {bound:.1f}")
print("mistakes per epoch:", mistakes_per)
print("total mistakes:", sum(mistakes_per))
print("training accuracy:", np.mean(np.sign(X_per @ w_per) == y_per))
R = 3.280, gamma = 1.409, (R/gamma)^2 = 5.4
mistakes per epoch: [1, 0, 0, 0, 0, 0, 0, 0, 0, 0, 0, 0, 0, 0, 0, 0, 0, 0, 0, 0]
total mistakes: 1
training accuracy: 1.0
fig, ax = plt.subplots(figsize=(5, 5))
ax.scatter(*X_per[y_per == 1].T, marker="o", label=r"$y=+1$")
ax.scatter(*X_per[y_per == -1].T, marker="s", label=r"$y=-1$")

xx = np.array([-2.2, 2.2])
ax.plot(xx, -w_true[0] / w_true[1] * xx, "k--", label="true boundary")
ax.plot(xx, -w_per[0] / w_per[1] * xx, "r-", label="perceptron boundary")

ax.set_xlim(-2.2, 2.2)
ax.set_ylim(-2.2, 2.2)
ax.set_xlabel("$x_1$")
ax.set_ylabel("$x_2$")
ax.legend(loc="upper left")
plt.show()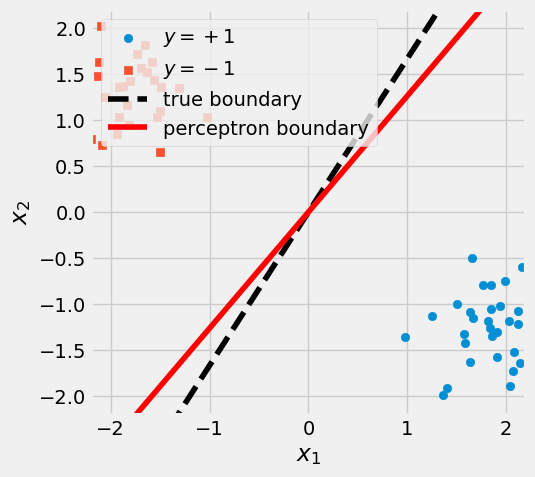
Why a single unit is not enough
The four points of the XOR problem are not linearly separable, so the perceptron has no that classifies them: the mistakes per epoch stop decreasing, and the accuracy stays at chance. This is not a defect of the learning rate — it is a statement about hyperplanes.
X_xor = np.array([[0.0, 0.0], [0.0, 1.0], [1.0, 0.0], [1.0, 1.0]])
y_xor = np.array([-1.0, 1.0, 1.0, -1.0])

w_xor, mistakes_xor = perceptron(X_xor, y_xor, epochs=10)
print("mistakes per epoch:", mistakes_xor)
print("perceptron accuracy:", np.mean(np.sign(X_xor @ w_xor) == y_xor))

# Brute force every line a*x1 + b*x2 + c = 0 on a coarse grid:
# this is an exhaustive search, not a learning algorithm.
best = 0.0
for a in np.linspace(-2, 2, 41):
    for b in np.linspace(-2, 2, 41):
        for c in np.linspace(-2, 2, 41):
            best = max(best, np.mean(np.sign(a * X_xor[:, 0] + b * X_xor[:, 1] + c) == y_xor))
print("best accuracy of any straight line:", best)
mistakes per epoch: [4, 4, 4, 4, 4, 4, 4, 4, 4, 4]
perceptron accuracy: 0.0
best accuracy of any straight line: 0.75
Online Learning
Batch learning sees all points before it updates anything; online learning sees one point at a time and has to predict before the label arrives. The perceptron is an online algorithm, and its mistake bound is an online guarantee: on any ordering of separable data the total number of mistakes is at most , whatever the order.
Three practical consequences, which is why the idea outlived the algorithm:
No stored dataset. The update uses one example, which is what makes streaming and very large possible; the batch gradient of the previous section is the same step averaged over the sample.
The order matters. Sweeping the data in the given order can lock the model into a bad route; shuffling each epoch — and averaging the iterates, the averaged perceptron — is the standard fix.
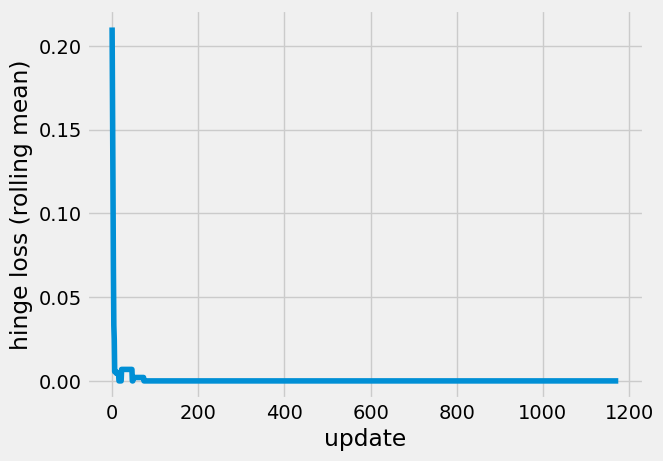
Learning rate. With the accumulated noise stays finite; with a constant the iterate keeps jittering around the solution, which is visible in the loss curve of the next lab.
Modern first-order training (SGD, momentum, Adam) is this same loop with a smooth loss and a better step rule — so the two remaining notebooks of this block are, in a sense, the perceptron with more layers.
Lab 2: the same rule as torch.optim.SGD on the hinge loss
The previous section trained a linear model with torch and the squared error; here the loss is
the hinge loss of the box above and the optimiser is the plain SGD of this lecture. Both models
separate the data, but the weight vectors differ: the perceptron stops at the first separating
vector it meets, while SGD on the hinge loss keeps pushing until every point has margin 1, so
its solution is the one with the smallest hinge loss, not the one that merely separates. Which
of the two is “better” depends on the goal — and on the test data, not on the training data.
import torch

torch.manual_seed(0)
X_t = torch.tensor(X_per, dtype=torch.float32)
y_t = torch.tensor(y_per, dtype=torch.float32)

model = torch.nn.Linear(2, 1, bias=False)
optimizer = torch.optim.SGD(model.parameters(), lr=0.05)

losses = []
for epoch in range(15):
    for i in torch.randperm(len(y_t)):
        xb, yb = X_t[i], y_t[i]
        loss = torch.clamp(1.0 - yb * model(xb), min=0.0)   # hinge loss
        optimizer.zero_grad()
        loss.backward()
        optimizer.step()
        losses.append(loss.item())

print("mean hinge loss over the last epoch:", np.mean(losses[-len(y_t):]))
with torch.no_grad():
    predictions = torch.sign(model(X_t)).squeeze().numpy()
print("training accuracy:", np.mean(predictions == y_per))
print("weights (torch):", model.weight.detach().numpy().ravel())
print("weights (perceptron, scaled):", w_per / np.linalg.norm(w_per))
window = 25
smooth = np.convolve(losses, np.ones(window) / window, mode="valid")
plt.plot(smooth)
plt.xlabel("update")
plt.ylabel("hinge loss (rolling mean)")
plt.show()
mean hinge loss over the last epoch: 0.0
training accuracy: 1.0
weights (torch): [ 0.81206715 -0.2167826 ]
weights (perceptron, scaled): [ 0.78386254 -0.62093439]
Exercises
Show that the perceptron update leaves every correctly classified point correct only if the margin is small enough; find the largest for which one specific point stays correct after an update, in terms of and .
Prove that the perceptron on separable data reaches zero training error in finitely many updates, and give an example where a bad ordering makes it take at least updates.
Derive the perceptron rule as SGD on the hinge loss (done above), then derive it as SGD on the squared loss with labels — and explain why the resulting rule is not the same.
Run Lab 1 with and with , and plot the total number of mistakes against . Explain what the theorem says about (hint: the bound does not depend on ; rescaled data does).
Show that a single linear score cannot compute XOR, and write down the smallest two-layer network with ReLU units that computes it. This is the starting point of the next notebook.
In an online setting, the cumulative mistake count is compared with the best fixed in hindsight. State why a linear model on non-separable data cannot have a bound, and what the perceptron guarantees instead (a bound in terms of ).
Further Reading:
Why use gradient descent for linear regression, when a closed-form math solution is available?
Some of the previous MSc thesis related to regression (In Persian):
- Zaki, M. J., & Meira, W. (2020). Data Mining and Machine Learning: Fundamental Concepts and Algorithms (2nd ed.). Cambridge University Press. https://www.cambridge.org/9781108497367