Clustering images by hierarchical clustering

Clustering images by hierarchical clustering
Mahmood Amintoosi, Fall 2026
Computer Science Dept, Ferdowsi University of Mashhad
# Auto-setup when running on Google Colab
import os
if 'google.colab' in str(get_ipython()) and not os.path.exists('/content/mfds'):
    !git clone https://github.com/fum-cs/mfds.git
    %cd mfds/notebooks
# import the required libraries
import os
import numpy as np
from PIL import Image
from sklearn.cluster import KMeans
import matplotlib.pyplot as plt
from skimage.color import rgb2hsv
from skimage.color import rgb2lab
from sklearn.cluster import AgglomerativeClustering
from scipy.cluster.hierarchy import dendrogram, linkage
# define the folder that holds the jpg images
folder = "images"
# read the images and convert them to NumPy arrays
images = []
for filename in os.listdir(folder):
if filename.endswith(".jpg"):
img = Image.open(os.path.join(folder, filename))
img = np.array(img)
images.append(img)
# number of images
n = len(images)
# compute the mean pixel intensity of each image
means = []
for img in images:
# img = rgb2hsv(img)
img = rgb2lab(img)
mean = np.mean(img, axis=(0, 1)) # mean over the height and width axes
means.append(mean)
# convert the list of means to a NumPy array
means = np.array(means)
# cluster the mean vectors with the k-means algorithm
k = 3 # number of clusters
# kmeans = KMeans(n_clusters=k, random_state=42)
# kmeans.fit(means)
# labels = kmeans.labels_ # cluster labels
clustering = AgglomerativeClustering(linkage='ward', n_clusters=k)
labels = clustering.fit_predict(means)
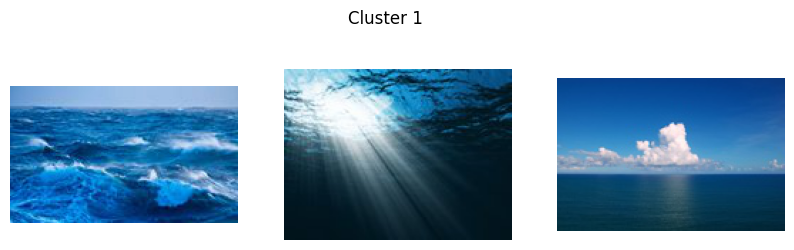
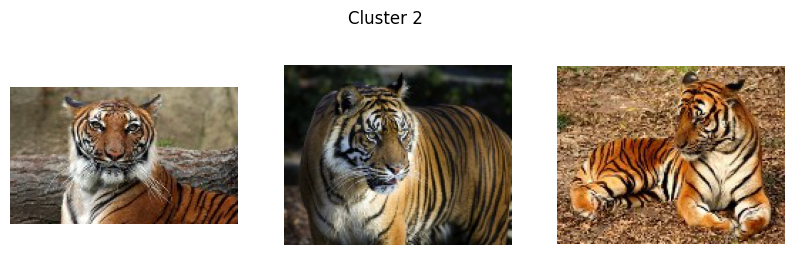
labelsarray([0, 0, 0, 1, 1, 1, 2, 2, 2], dtype=int64)# display the images of each cluster
for i in range(k):
# select the images that belong to cluster i
cluster = [images[j] for j in range(n) if labels[j] == i]
# number of images in cluster i
m = len(cluster)
# set the figure size used to display the images
plt.figure(figsize=(10, 3))
# loop over the images to display them
for j in range(m):
# create a subplot for each image
plt.subplot(1, m, j + 1)
# remove the axes
plt.axis("off")
# display the image
plt.imshow(cluster[j])
# display the figure title
plt.suptitle(f"Cluster {i}")
# display the figure
plt.show()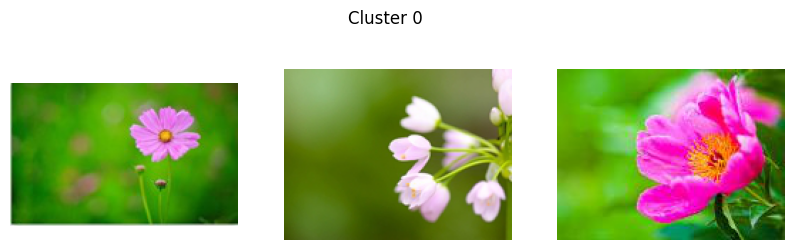
linkage_matrix = linkage(means, method='ward')  # Create linkage matrix
linkage_matrix
array([[ 3. , 5. , 11.38215326, 2. ],
[ 6. , 7. , 14.68492426, 2. ],
[ 1. , 2. , 15.82979712, 2. ],
[ 8. , 10. , 24.22373583, 3. ],
[ 4. , 9. , 27.95633024, 3. ],
[ 0. , 11. , 30.62255948, 3. ],
[ 12. , 14. , 57.55943682, 6. ],
[ 13. , 15. , 107.55176707, 9. ]])from scipy.cluster.hierarchy import leaves_list
linkage_matrix = linkage(means, method='ward') # Create linkage matrix
leaf_order = leaves_list(linkage_matrix)
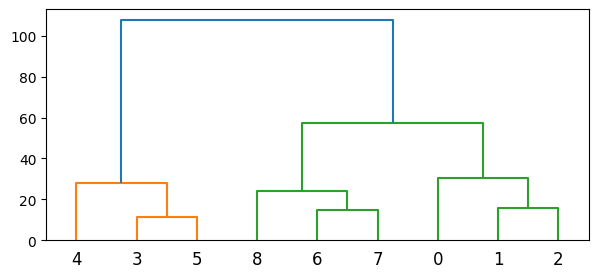
leaf_orderarray([4, 3, 5, 8, 6, 7, 0, 1, 2], dtype=int32)plt.figure(figsize=(7, 3))
dendrogram(linkage_matrix, labels=range(len(means)))
plt.show()
for j in range(n):
# create a subplot for each image
plt.subplot(1, n, j + 1)
# remove the axes
plt.axis("off")
# display the image
plt.imshow(images[leaf_order[j]])
plt.tight_layout()
plt.show()