kNN in high dimensional spaces

kNN in high dimensional spaces
The curse of dimensionality
Mahmood Amintoosi, Fall 2026
Computer Science Dept, Ferdowsi University of Mashhad
import numpy as np
from sklearn.model_selection import train_test_split
from sklearn.neighbors import KNeighborsClassifier
from sklearn.metrics import accuracy_score
from sklearn.datasets import make_classification
import matplotlib.pyplot as plt
import seaborn as sns
from scipy.stats import norm
n_samples = 1000
n_classes = 2
# Define an empty list to store the accuracy scores
scores = []
n_dimensions = [2, 5, 10, 50, 100]# , 200]#, 1000]
for d in n_dimensions:
X, y = make_classification(
n_samples=n_samples,
n_features=d,
n_classes = n_classes,
n_redundant=0,
n_informative=2,
random_state=1,
n_clusters_per_class=1,
)
# Split the data into train and test sets
X_train, X_test, y_train, y_test = train_test_split(
X, y, test_size=0.2, random_state=42
)
# Train a k-nearest neighbor classifier with k=5
clf = KNeighborsClassifier(n_neighbors=5)
clf.fit(X_train, y_train)
# Predict the test labels
y_pred = clf.predict(X_test)
# Compute the accuracy score
score = accuracy_score(y_test, y_pred)
scores.append(score)
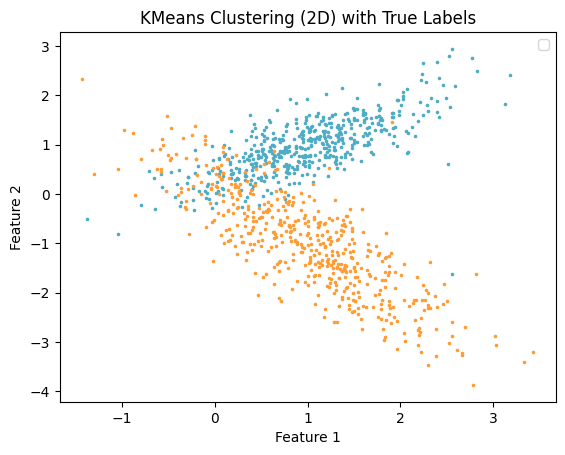
if d == 2:
# Plot init seeds along side sample data
plt.figure(1)
colors = ["#4EACC5", "#FF9C34", "#4E9A06", "m"]
for k in range(n_classes):
cluster_data = y == k
plt.scatter(X[cluster_data, 0], X[cluster_data, 1], c=colors[k], marker=".", s=10)
plt.legend()
plt.title("KMeans Clustering (2D) with True Labels")
plt.xlabel("Feature 1")
plt.ylabel("Feature 2")
plt.show()
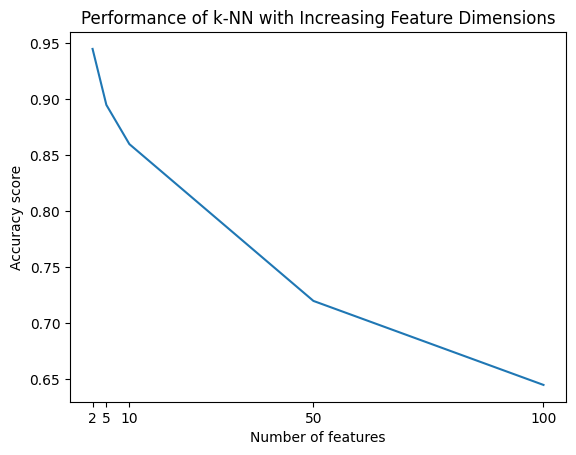
# Plot the accuracy scores versus the number of features
plt.plot(n_dimensions, scores)
plt.xlabel("Number of features")
plt.ylabel("Accuracy score")
plt.title("Performance of k-NN with Increasing Feature Dimensions")
plt.xticks(n_dimensions)
# plt.xscale("log")
plt.show()No artists with labels found to put in legend. Note that artists whose label start with an underscore are ignored when legend() is called with no argument.