خوشهبندی تصویرها

گروه علوم کامپیوتر، دانشگاه فردوسی مشهد
Source
# Auto-setup when running on Google Colab
import os
if 'google.colab' in str(get_ipython()) and not os.path.exists('/content/mfds'):
    !git clone https://github.com/fum-cs/mfds.git
    %cd mfds/notebooks
• سپس میانگین شدت پیکسلهای هر تصویر را حساب میکند و از آنها یک بردار سهبُعدی میسازد.
• بعد با الگوریتم k-means از scikit-learn این بردارهای میانگین را خوشهبندی میکند. تعداد خوشهها را هرطور که بخواهید میتوانید تعیین کنید.
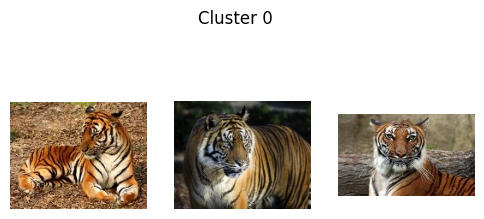
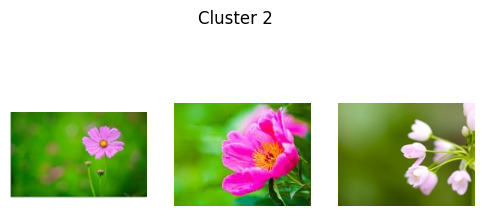
• در پایان تصویرهای هر خوشه را با matplotlib نشان میدهد.
# import the required libraries
import os
import numpy as np
from PIL import Image
from sklearn.cluster import KMeans
import matplotlib.pyplot as plt
from skimage.color import rgb2hsv
from skimage.color import rgb2lab
from skimage import transform, io

# define the folder that holds the jpg images
folder = "images"

# read the images and convert them to NumPy arrays
images = []
for filename in os.listdir(folder):
    # if filename.endswith(".jpg"):
        img = Image.open(os.path.join(folder, filename))
        img = np.array(img)
images.append(img)img.shape(120, 160, 3)# number of images
n = len(images)
plt.figure(figsize=(5, 3))
# loop over the images to display them
for j in range(n):
# create a subplot for each image
plt.subplot(3, n//3, j + 1)
# remove the axes
plt.axis("off")
# display the image
plt.imshow(images[j])
# display the figure
plt.show()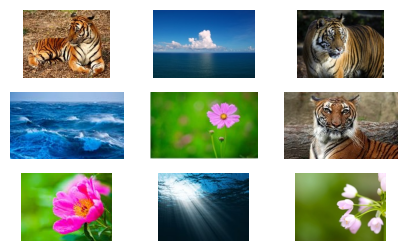
# compute the mean pixel intensity of each image
means = []
for img in images:
    # img = rgb2hsv(img)
    # img = rgb2lab(img)
    mean = np.mean(img, axis=(0, 1)) # mean over the height and width axes
    means.append(mean)

# convert the list of means to a NumPy array
X = np.array(means)
print(X.shape)
# cluster the mean vectors with the k-means algorithm
k = 3
kmeans = KMeans(n_clusters=k, random_state=42)
kmeans.fit(X)
labels = kmeans.labels_ # cluster labels

# display the images of each cluster
for i in range(k):
    # select the images that belong to cluster i
    cluster = [images[j] for j in range(n) if labels[j] == i]
    # number of images in cluster i
    m = len(cluster)
    # set the figure size used to display the images
    plt.figure(figsize=(6, 3))
    # loop over the images to display them
    for j in range(m):
        # create a subplot for each image
        plt.subplot(1, m, j + 1)
        # remove the axes
        plt.axis("off")
        # display the image
        plt.imshow(cluster[j])
    # display the figure title
    plt.suptitle(f"Cluster {i}")
    # display the figure
    plt.show()
(9, 3)
/usr/local/lib/python3.10/dist-packages/sklearn/cluster/_kmeans.py:870: FutureWarning: The default value of `n_init` will change from 10 to 'auto' in 1.4. Set the value of `n_init` explicitly to suppress the warning
  warnings.warn(
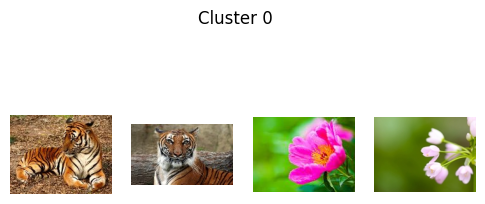
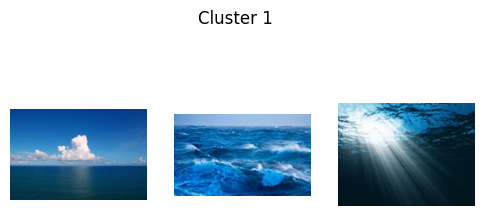
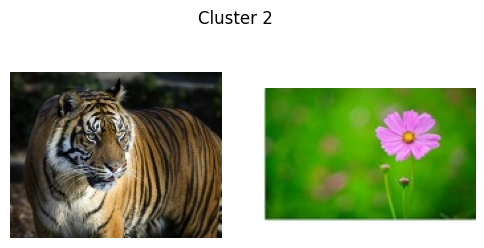
خوشهبندی تصویر در فضای با ابعاد بالا
mean.shape(3,)print(img.shape)
resized_image = transform.resize(img, (100, 100))
print(resized_image.shape)
flatted_image = resized_image.reshape(100*100,3)
print(flatted_image.shape)
print(resized_image[0,0,:])
print(flatted_image[0])
flatted_image = resized_image.reshape(100*100*3)
print(flatted_image.shape)
print(resized_image[0,0,:])
print(flatted_image[:3])(120, 160, 3)
(100, 100, 3)
(10000, 3)
[0.56470588 0.67689584 0.38695552]
[0.56470588 0.67689584 0.38695552]
(30000,)
[0.56470588 0.67689584 0.38695552]
[0.56470588 0.67689584 0.38695552]
# resize the images to 100 x 100 pixels
flatted_images = []
for img in images:
    img = rgb2hsv(img)
    # img = rgb2lab(img)
    resized_image = transform.resize(img, (100, 100))
    flatted_images.append(resized_image.reshape(100*100*3))

X = np.array(flatted_images)
print(X.shape)
# cluster the mean vectors with the k-means algorithm
k = 3
kmeans = KMeans(n_clusters=k, random_state=42)
kmeans.fit(X)
labels = kmeans.labels_ # cluster labels

# display the images of each cluster
for i in range(k):
    # select the images that belong to cluster i
    cluster = [images[j] for j in range(n) if labels[j] == i]
    # number of images in cluster i
    m = len(cluster)
    # set the figure size used to display the images
    plt.figure(figsize=(6, 3))
    # loop over the images to display them
    for j in range(m):
        # create a subplot for each image
        plt.subplot(1, m, j + 1)
        # remove the axes
        plt.axis("off")
        # display the image
        plt.imshow(cluster[j])
    # display the figure title
    plt.suptitle(f"Cluster {i}")
    # display the figure
    plt.show()
(9, 30000)
/usr/local/lib/python3.10/dist-packages/sklearn/cluster/_kmeans.py:870: FutureWarning: The default value of `n_init` will change from 10 to 'auto' in 1.4. Set the value of `n_init` explicitly to suppress the warning
  warnings.warn(
تمرینها
پیکسلهای یک تصویر را در فضای RGB با خوشهبندی کنید و نتیجه را بهصورت تصویر نشان دهید. توضیح دهید چرا مرزهای ناحیهها از رنگ پیروی میکنند نه از موقعیت.
مختصات را با وزن به ویژگیهای رنگی بیفزایید، را بگردید و بدهبستان میان وفاداری رنگ و پیوستگی مکانی را توصیف کنید.
اندازهٔ ماتریس ویژگیهای یک تصویر RGB با ابعاد را حساب کنید و هزینهٔ یک تکرار k-means با را برآورد کنید. خوشهبندی سلسلهمراتبی در مقایسه چگونه است؟