k-means در فضاهای با ابعاد بالا

گروه علوم کامپیوتر، دانشگاه فردوسی مشهد
Source
import numpy as np
import matplotlib.pyplot as plt
from sklearn.datasets import make_classification
from sklearn.cluster import KMeans
from sklearn.metrics import adjusted_rand_score
n_samples = 1000
n_classes = 2
# Define an empty list to store the scores
scores = []
n_dimensions = [2, 5, 10, 50, 100, 200] # List of dimensions to evaluate
for d in n_dimensions:
# Generate synthetic Gaussian data
X, y = make_classification(
n_samples=n_samples,
n_features=d,
n_classes=n_classes,
n_redundant=0,
n_informative=2,
random_state=1,
n_clusters_per_class=1,
)
# Fit KMeans
kmeans = KMeans(n_clusters=n_classes, random_state=42)
kmeans.fit(X)
# Predict the cluster labels
y_pred = kmeans.labels_
# Compute the clustering score using Adjusted Rand Index
score = adjusted_rand_score(y, y_pred)
scores.append(score)
if d == 2:
# Plot initial seeds alongside sample data for the 2D case
plt.figure(1)
colors = ["#4EACC5", "#FF9C34"]
for k in range(n_classes):
cluster_data = y == k
plt.scatter(X[cluster_data, 0], X[cluster_data, 1], c=colors[k], marker=".", s=10)
# Plot cluster centroids
centroids = kmeans.cluster_centers_
plt.scatter(centroids[:, 0], centroids[:, 1], c='red', marker='X', s=100, label='Centroids')
plt.legend()
plt.title("KMeans Clustering (2D) with True Labels")
plt.xlabel("Feature 1")
plt.ylabel("Feature 2")
plt.show()
# Plot the clustering scores versus the number of features
plt.plot(n_dimensions, scores)
plt.xlabel("Number of features")
plt.ylabel("Adjusted Rand Index")
plt.title("Clustering Performance of KMeans with Increasing Feature Dimensions")
plt.xticks(n_dimensions)
plt.grid()
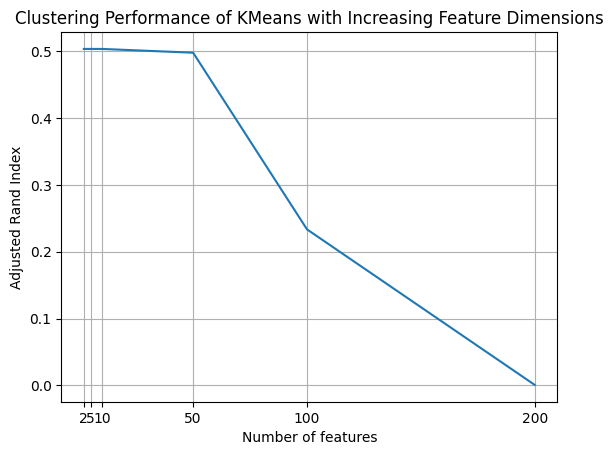
plt.show()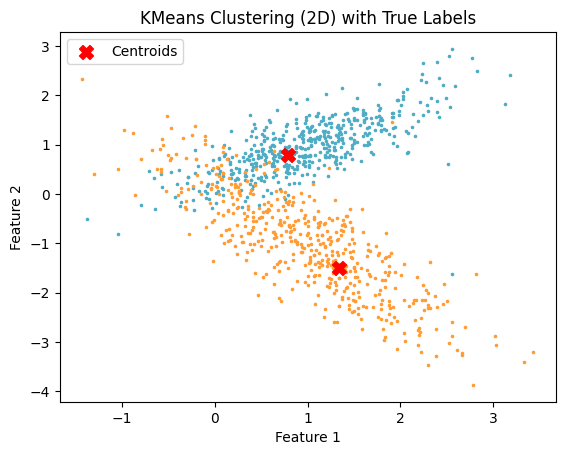
تمرینها
مرکز را روی یک شبکه در بگذارید و امید ریاضی فاصلهٔ مجذور یک نقطهٔ یکنواخت تا نزدیکترین مرکز را برای و حساب کنید. رشد آن را توضیح دهید.
استدلال کنید که یک افراز به ناحیهٔ محدب حداکثر ناحیه را جدا میکند، در حالی که پوشاندن مکعب با یک تفکیک ثابت تقریباً ناحیه میخواهد. این دربارهٔ ثابت وقتی بزرگ میشود چه میگوید؟
k-means را با ثابت و روبهرشد روی دادهٔ ساختگی با تعداد ثابتی خوشهٔ واقعی اجرا کنید. inertia و ARI را برحسب رسم کنید و دو منحنی را تفسیر کنید.