Images as high dimensional data

Computer Science Dept, Ferdowsi University of Mashhad
# Importing Necessary Libraries
import numpy as np
import matplotlib.pyplot as plt
img = np.random.randint(10, size=(5,6))
imgarray([[3, 0, 5, 6, 3, 3],
[4, 8, 6, 5, 4, 7],
[6, 6, 1, 7, 8, 1],
[9, 1, 0, 6, 7, 8],
[4, 5, 1, 4, 0, 5]])plt.figure(figsize=(3,4))
plt.imshow(img, cmap=plt.cm.gray)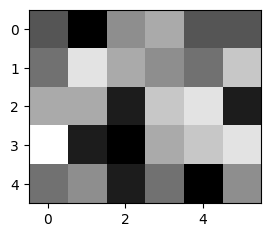
Image segmentation by thresholding
seg_img = img > 5
type(seg_img), seg_img
(numpy.ndarray,
array([[False, False, False, True, False, False],
[False, True, True, False, False, True],
[ True, True, False, True, True, False],
[ True, False, False, True, True, True],
[False, False, False, False, False, False]]))# plot each image ...
# ... side by side
fig=plt.figure(figsize=(6, 4))
fig.add_subplot(1, 2, 1) # subplot one
plt.imshow(img, cmap=plt.cm.gray)
fig.add_subplot(1, 2, 2) # subplot two
# my data is OK to use gray colormap (0:black, 1:white)
plt.imshow(seg_img, cmap=plt.cm.gray) # use appropriate colormap here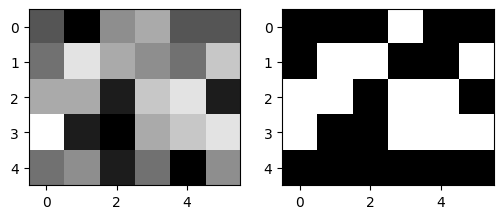
# !pip install scikit-imageRGB2Gray
# Importing Necessary Libraries
from skimage import data
from skimage.color import rgb2gray
import matplotlib.pyplot as plt

# Sample Image of scikit-image package
coffee = data.coffee()
coffee.shape,  type(coffee[0,0,0])
((400, 600, 3), numpy.uint8)# Setting the plot size to 15,15
plt.figure(figsize=(10, 5))
plt.subplot(1, 2, 1)
# Displaying the sample image
plt.imshow(coffee)
# Converting RGB image to Monochrome
gray_coffee = rgb2gray(coffee)
plt.subplot(1, 2, 2)
# Displaying the sample image - Monochrome
# Format
plt.axis('off')
plt.imshow(gray_coffee, cmap="gray")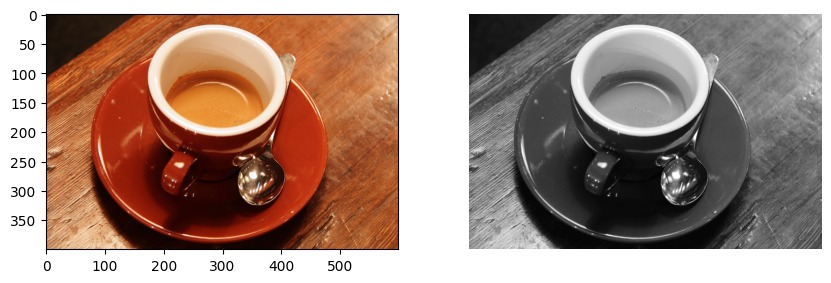
plt.figure(figsize=(8, 12))

for i in range(10):

    # Iterating different thresholds
    binarized_gray = gray_coffee > i*0.1
    plt.subplot(5,2,i+1)

    # Rounding of the threshold
    # value to 1 decimal point
    plt.title("Threshold: >"+str(round(i*0.1,1)))

    # Displaying the binarized image
    # of various thresholds
    plt.imshow(binarized_gray, cmap = 'gray', vmin=0, vmax=1)

plt.tight_layout()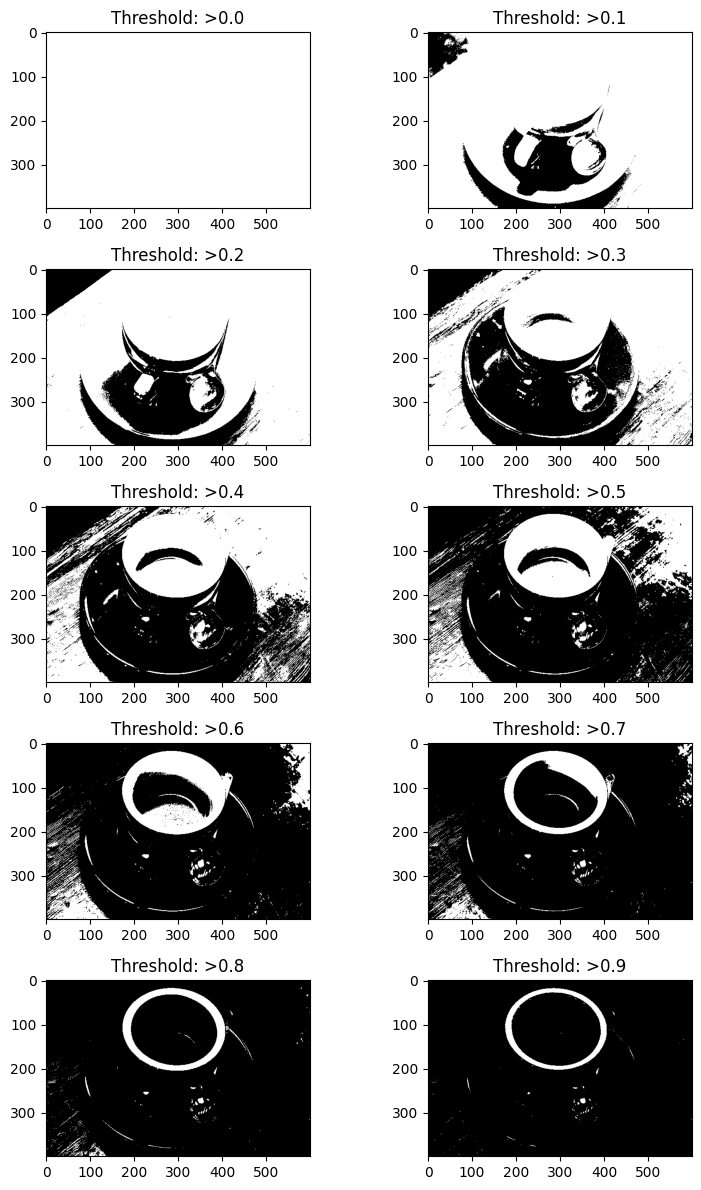
Exercises
Load the image used on this page, print its shape, dtype and
nbytes, and compute the mean image over the colour axis. Explain each number in terms of rows, columns and channels.Segment the image by thresholding on grey level: choose the threshold with Otsu’s method, then compare with three fixed thresholds. Which object does the automatic threshold recover?
Flatten ten images into vectors and compute the pairwise Euclidean distance matrix. Identify the two most similar images and check by eye whether the metric agrees.